Digital relationship mapping platform to understand cancer research ecosystems and transform investor reporting.
The Brief:
Property developer Socius needed to transform their networking activity on projects. Taking a conceptual prototype to a working digital tool that could support both relationship mapping capabilities and insight integration for investor reporting.
Role
Lead Product and UX/UI Designer
Team
2x User Researchers
UX Designer
Tools
Miro, Figma, Adobe Creative Suite
1. Discovery
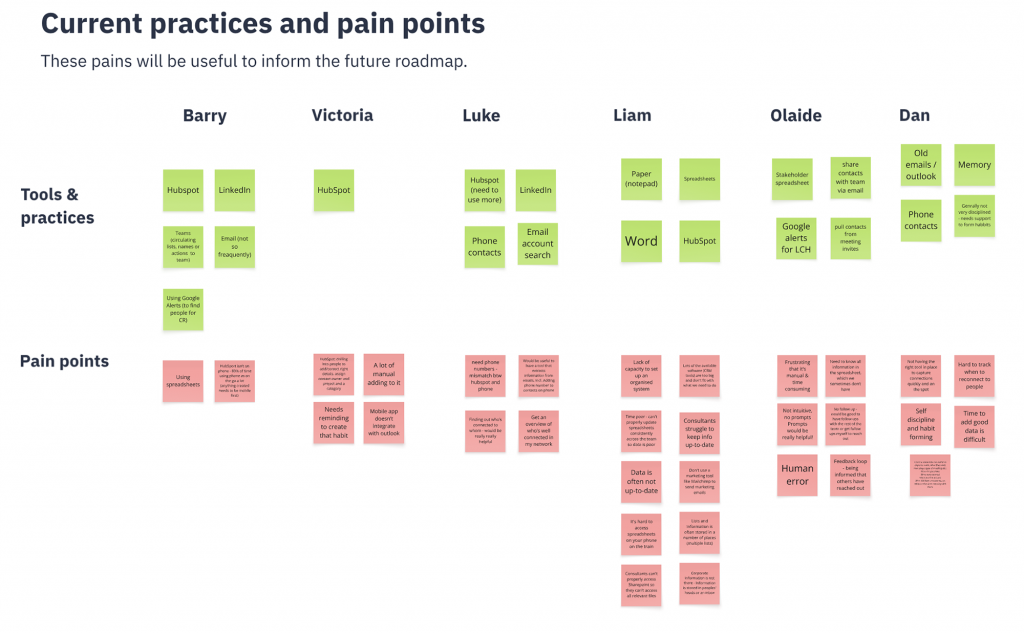
As project lead, I guided my team through comprehensive user research with client team members from different business areas in order to understand competing needs and priority platform features.
Key Actions and Discoveries:
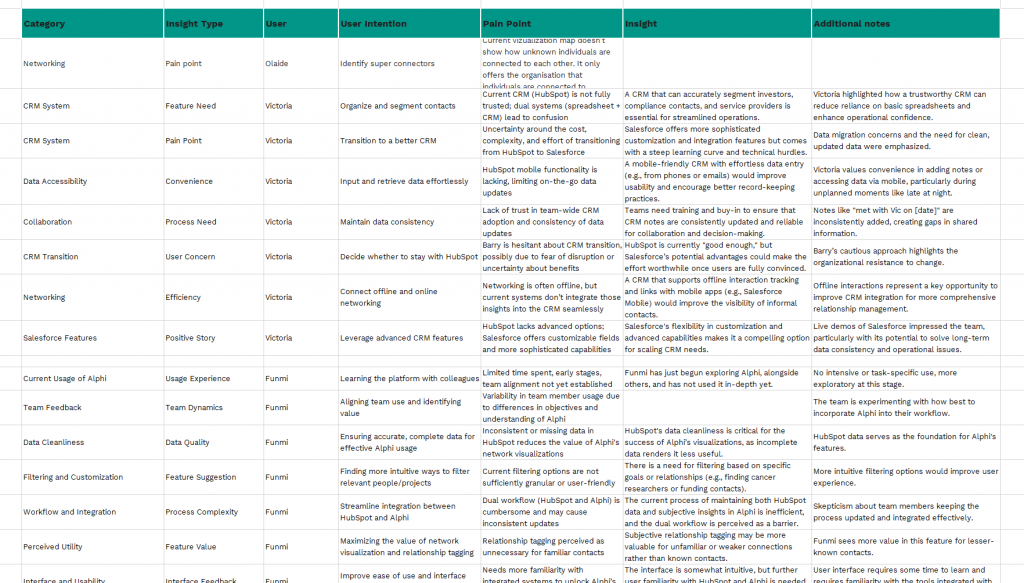
Led team to conduct user research (surveys and user interviews) with client team members from multiple business areas to identify competing priorities
Oversaw testing of existing platform features through user observations and interviews
Directed analysis of current relationship data to understand how different teams used contact information
Guided discovery of unused platform features and confusing interface elements
Led identification of ethical constraints around external data integration
2. Ideate
I directed my team to translate user insights into design concepts while addressing ethical constraints around external data integration.
KeyIdeation:Activities:
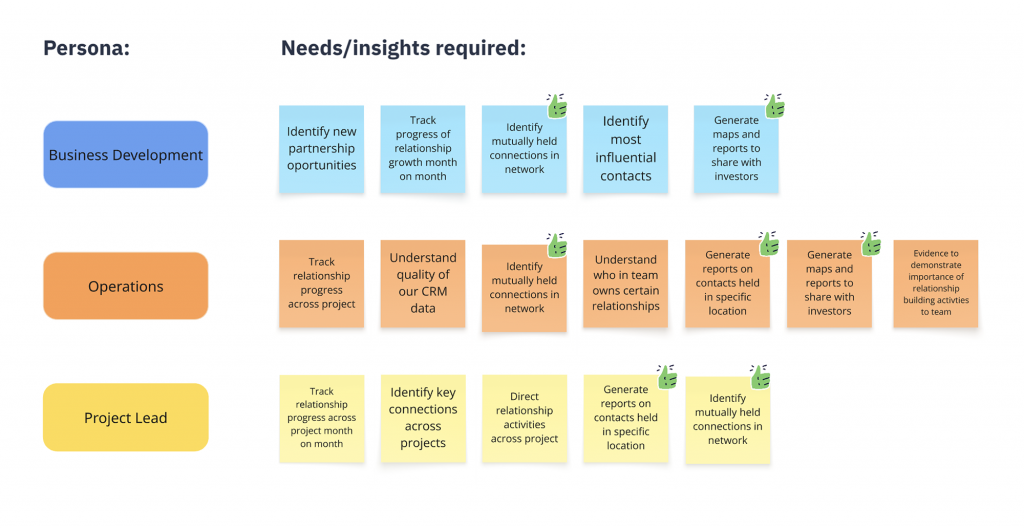
Led team creation of user personas and stories based on our research findings
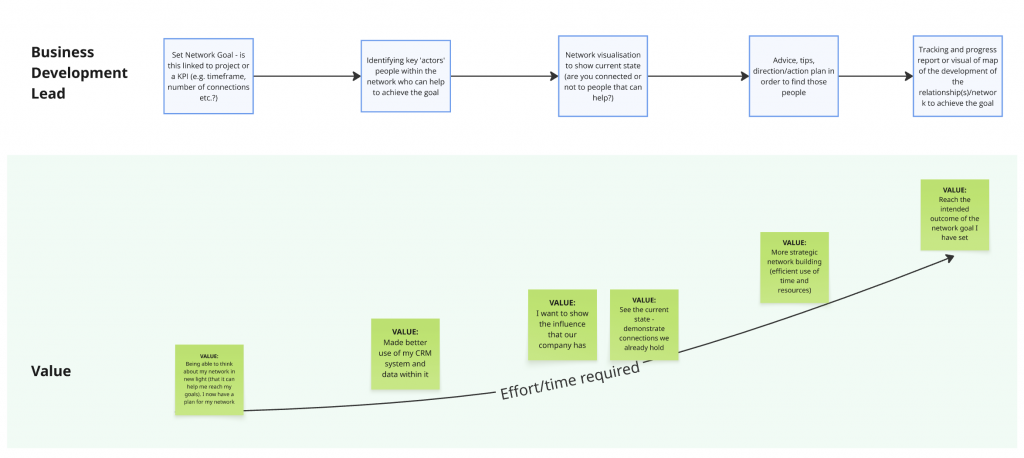
Took the lead in mapping out information architecture to understand complex relationship data (our solution would sync with the client’s CRM system and link to multiple relationship data sources)
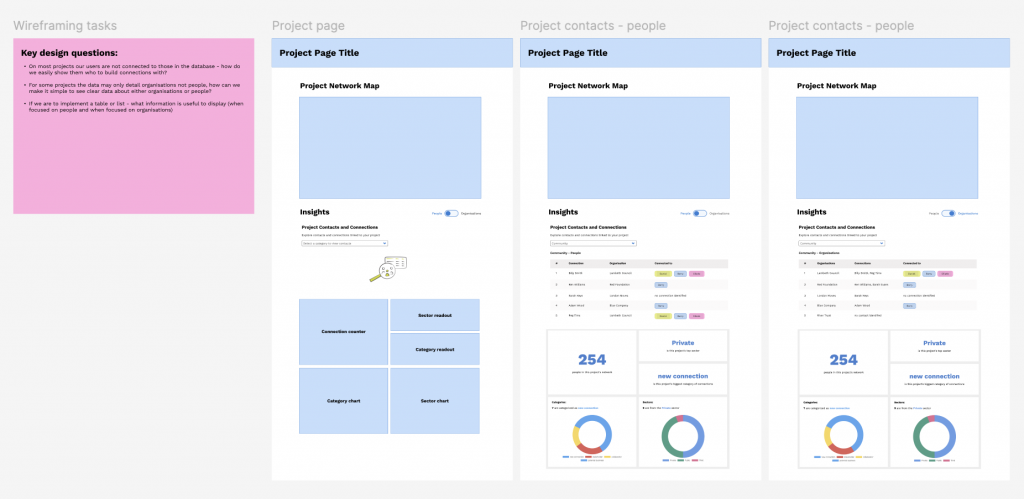
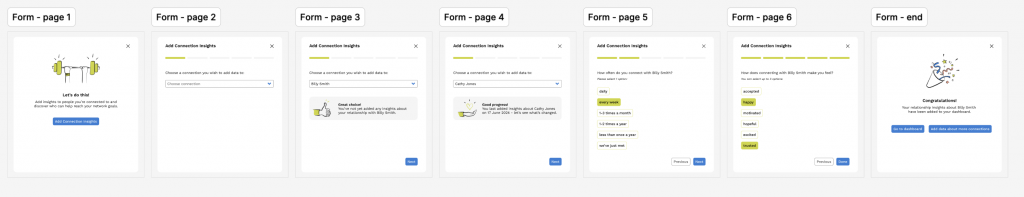
Led prototyping of manual data entry workflows to give users more control over information accuracy and insights
Guided development of network visualisation concepts and facilitated testing and priority voting with client stakeholders
Feedback from clients identified that dashboards should present role-specific insights
3. Design
I led my team to take research-driven design decisions, focusing on improving the quality of network visualisations, developing role-specific dashboards and balancing user needs with resource and time constraints.
Key DesignActions:
Led team to prioritise network visualisation features over other tools based on user feedback
Directed complete interface re-design when users couldn’t understand existing data charts
Guided team to design role-specific data dashboards presenting key insights back to specific personas such as project managers, commercial directors and community connectors
Oversaw the secure integration of partner data while maintaining user privacy controls
4. Delivery
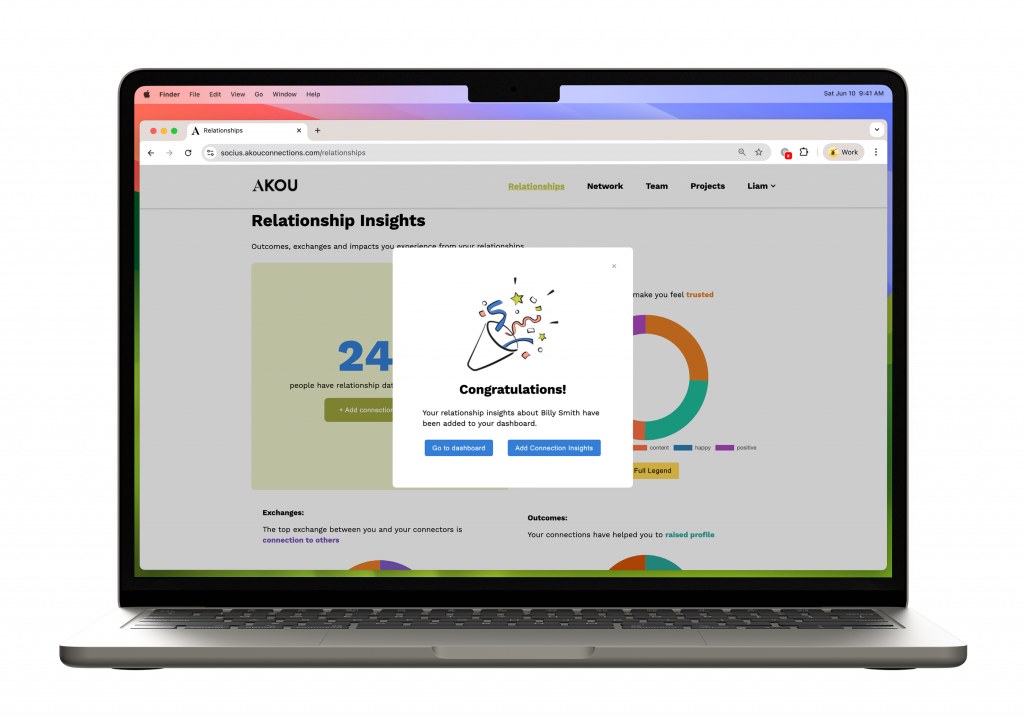
Under my leadership, the team delivered a research-informed tool that achieved measurable improvements in relationship data quality and user engagement for Socius, providing them with more robust insights to demonstrate their progress to project investors.
FinalOutcomes:
Data quality
Platform delivery achieved 20% improvement in relationship data quality within first month of use
Targeted networking
Insights on project networks identified 8 new partnership opportunities
Insights visualised
Enabled monthly investor presentations with clear visual network insights instead of raw data
Data security
Successfully launched platform balancing user needs with strict data privacy requirements